Qualitative vs Quantitative Customer Data: How to Use Both for Better Digital Experiences
To deliver meaningful experiences, businesses need more than metrics. They need to understand what customers are doing and why they’re doing it. Whether it’s a user abandoning a purchase or hesitating on a page, these behaviors leave behind patterns that can be measured or explored. This is where qualitative and quantitative data come in.
Each method tells a different part of the story. Quantitative data shows what’s happening in numbers and trends. Qualitative data uncovers the reasoning behind those actions. On their own, each method has value. Together, they create a clearer, more complete picture of customer behavior.
With tools like customer analytics, teams can now access both data types in real time, capturing structured metrics and human-centered insights from the same user journey. This article explores the difference between qualitative and quantitative research approaches, how each is collected and used and why blending both is essential for enhancing digital experiences.
What’s the Difference Between Qualitative and Quantitative Data?
When discussing customer analytics, you’ll frequently hear the phrases “qualitative research” and “quantitative research.” Both serve the same ultimate purpose—understanding human behavior—but they approach that goal from opposite directions.
Qualitative data is the rich narrative layer. It captures subjective experiences, emotions and motivations in customers’ own words. Think of one-on-one interviews, session replays or open-ended Voice of Customer surveys that reveal why a frustrated user abandons a sign-up form. Because it relies on descriptive language, a qualitative method is excellent for exploring complex phenomena, uncovering underlying reasons, and shaping your next research question.
Quantitative data, by contrast, distills those experiences into numbers that can be measured, benchmarked, and modeled. Page-load times, click-through rates and Likert scale scores all fall under quantitative analysis. This structured information enables statistical significance testing, causal relationship exploration and rapid comparison across cohorts at scale.
A quick illustration brings the difference to life:
Qualitative insight: In follow-up calls, shoppers say they abandon their cart because the shipping calculator appears too late in the process.
Quantitative metric: A dashboard showing a 40% cart abandonment rate between the shipping step and the payment step.
Separately, each fact tells part of the story. Together, they provide both the “how many” and the “why,” turning abstract numbers into actionable strategy.
Grasping these distinctions sets the stage for understanding how each type of data is gathered—a crucial step before you decide which research method to deploy.
Data Collection Methods: How Qualitative and Quantitative Insights Are Gathered
To translate “qualitative vs quantitative” from theory into practice, you need concrete ways to collect each variety of customer data. Below is a closer look at the most common research methods used in digital experience analytics.
Omnichannel success means every channel—mobile, desktop, voice, ATM, in-app or branch—feels like one continuous conversation. When customers check a mortgage rate on their phone at lunch and finalize the application on a laptop that evening, they expect to pick up exactly where they left off, with no repeated forms or lost context.
Gathering qualitative insights
Qualitative research methods focus on collecting descriptive information that reveals underlying reasons, feelings and expectations. You’ll typically lean on small, carefully selected samples to dig deep.
To illustrate, consider a financial services onboarding flow. Session replays might reveal hesitation when customers enter personal data, while follow-up interviews uncover that the language around data privacy feels vague. Together, these qualitative studies spotlight friction you can’t see in aggregate numbers alone.
Gathering quantitative insights
Quantitative research relies on structured instruments that turn user behavior into metrics you can chart, segment and compare, such as:
Analytics dashboards: Aggregated events, such as conversions or step-completion rates, quantify performance across segments or channels
A/B testing: Controlled experiments test hypotheses, such as whether rephrasing an interest-rate disclaimer boosts form completion
Heatmaps and scroll-depth tracking: Numerical counts show exactly where drop-offs spike or engagement slows
Funnel and journey reports: Statistical method outputs visualize user flow and identify causal relationships between earlier steps and later outcomes
In a single day, a banking app might log thousands of data points—tap counts, biometric log-ins and session durations—that feed inferential statistics and descriptive statistics alike.
How Glassbox unifies both streams in real time
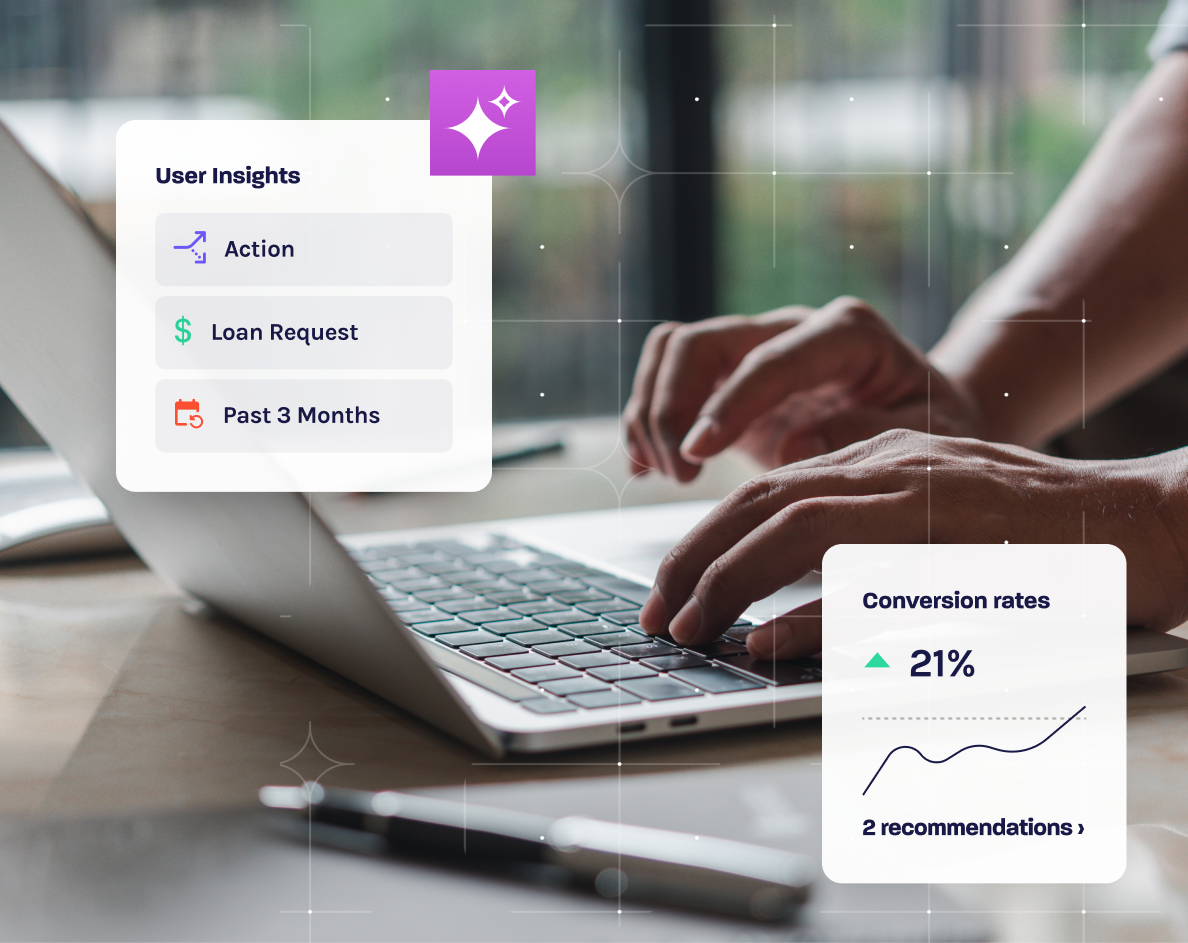
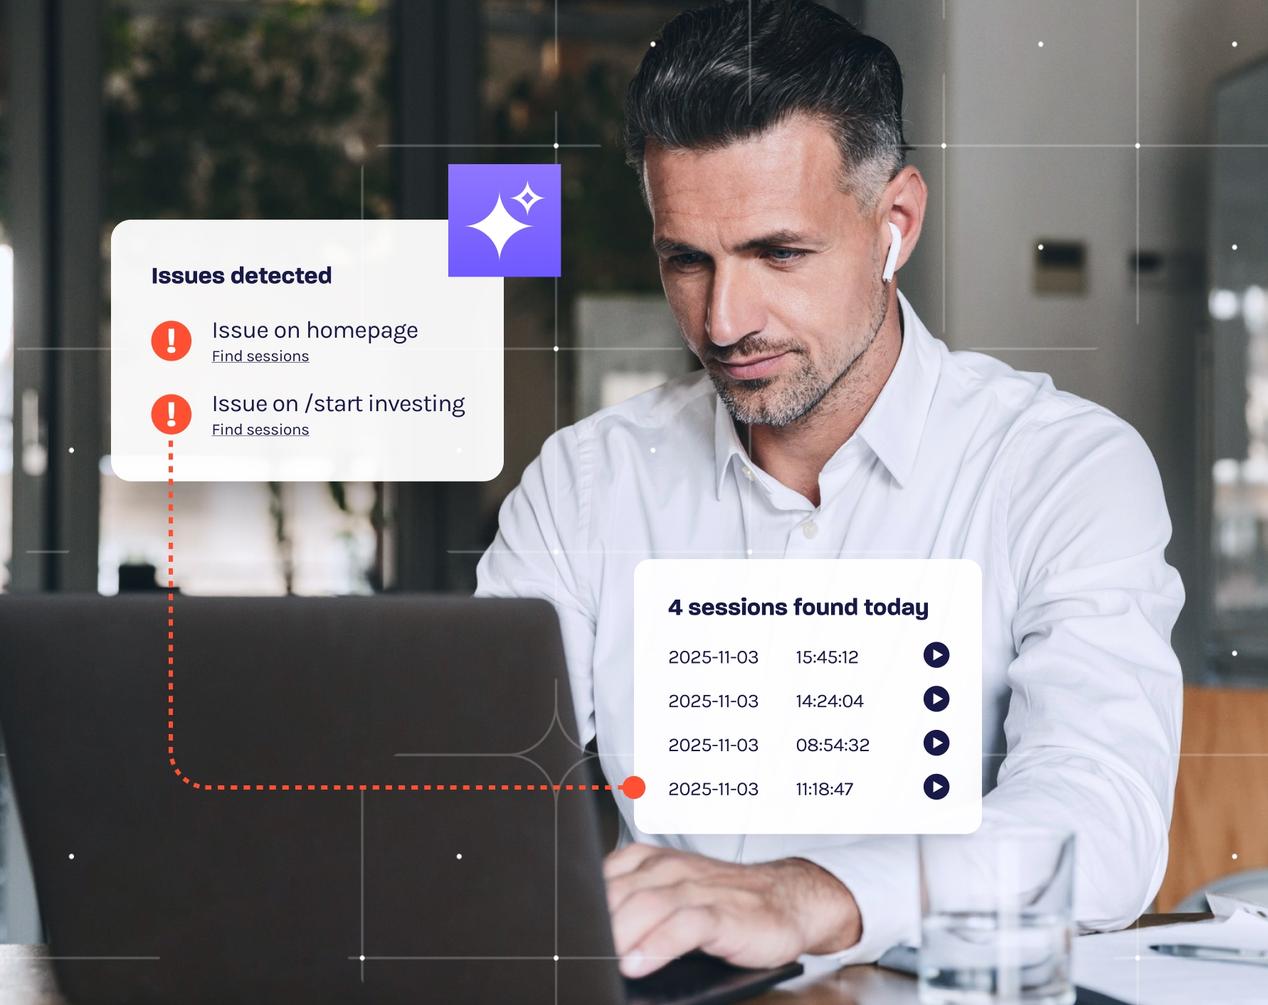
Modern platforms compress what once took weeks of manual tagging into minutes. Glassbox, for instance, captures every user interaction without code changes, applies AI-based tagging to group events, then stitches qualitative clues, like rage-click replays, directly alongside numerical trends. Analysts can pivot from a spike in abandonment (quantitative question) to watching the exact struggle (qualitative answer) in seconds.
By housing both data types in one product analytics workspace, Glassbox eliminates blind spots, accelerates root-cause discovery and equips cross-functional teams with a unified source of truth.
Putting the methods to work
To see the synergy in action, imagine you notice a 15% drop in loan-application completion over the past week. Quantitative dashboards flag the decline and pinpoint the step. Session replays reveal customers toggling back and forth on the income field, while interview snippets confirm confusion about gross versus net figures. Armed with both qualitative analysis and quantitative analysis, you redesign the field label, rerun the A/B test and watch conversions rebound.
Collecting the data is step one. The next step is weighing the strengths and limitations of each approach so you can choose the right balance for any given question.
Qualitative vs. Quantitative: The Pros and Cons of Each Approach
Evaluating the merits of qualitative vs quantitative research is less about crowning a winner and more about recognizing how each fills the other’s gaps.
Each approach shines in its own way. However, each should also be approached with caution in certain instances. Qualitative research, for example, delivers richer stories but struggles to scale, whereas quantitative methods scale seamlessly but can miss the story. In practice, relying solely on one can skew decisions.
Pairing both approaches together produces the greatest lift in areas such as personalization. Quantitative data segments customers by behavior and value, then qualitative insights explain why one segment prefers a particular mobile flow. The combination allows you to test hypotheses quickly, refine messaging and iterate with confidence.
Still, neither method is flawless:
Qualitative studies risk over-interpreting themes drawn from small sample sizes.
Quantitative analysis can mistake correlation for causation, especially when key variables remain untagged.
Time and resource constraints may force teams to choose breadth over depth or vice versa, limiting overall insight quality.
Recognizing these limitations prepares you to tackle an equally important question: How reliable is the information you collect?
Addressing Bias and Reliability in Customer Data
Even the sharpest data analysis can lead you astray if bias creeps into your research process. Because qualitative and quantitative methods rely on different collection techniques, they are vulnerable to different distortions, and both can undermine statistical significance or valuable insights if left unchecked.
Qualitative research often hinges on human interaction, so human bias looms large. Interviewer bias surfaces when leading questions nudge participants toward a preferred answer, while recall bias appears when users cannot accurately remember past events. Social desirability bias can mask negative feedback if respondents want to appear agreeable in user interviews or open-ended surveys. These subjective influences color the narrative and may cause your qualitative insights to overstate or understate a pain point.
Quantitative studies, though grounded in numbers, have their own pitfalls. Sampling bias skews results if your data set overrepresents power users and underrepresents new visitors. Confirmation bias can arise when analysts cherry-pick metrics that support a preconceived hypothesis. Measurement bias occurs when instrument errors—say, an event tag firing twice—inflate click counts and distort inferential statistics. Left uncorrected, such issues compromise the reliability of your quantitative data analysis and may lead to flawed causal relationship assumptions.
Modern AI capabilities help contain both threats. Glassbox’s anomaly detection engine continuously compares live behavior against historical baselines, flagging outliers that hint at data entry errors or misaligned metrics. Pattern recognition models scan thousands of session replays to identify recurring qualitative themes, reducing the chance that a single anecdote will dictate strategy. When AI spots shifts, like a sudden drop in form completion confined to a specific browser, it prompts you to validate the data before acting, preserving empirical research integrity.
You can further mitigate bias through proven research process safeguards:
Probability sampling ensures every user type, from first-time guest to platinum account holder, has an equal chance of inclusion.
Triangulation blends multiple data sources, such as survey responses, heatmaps and support logs, to validate qualitative insights against quantitative trends.
Neutral question phrasing removes suggestive language that might steer interviewees toward desired answers.
Blind or double-blind A/B tests prevent analyst expectations from influencing experiment outcomes.
Adopting those practices, along with AI-powered quality checks, fortifies your findings so your next research question rests on dependable ground.
With bias under control, the practical challenge becomes knowing when each research method—or a mixed methods research design—delivers the greatest ROI.
Platforms like Glassbox use AI to detect behavioral anomalies, flag frustration indicators and correct inconsistencies, which transforms digital customer interactions through more reliable, comprehensive insights.
When and How to Use Each Type of Data
Choosing the right research method starts with clarifying the decision you need to make. Early-stage discovery work calls for the nuance of qualitative research, while optimization and forecasting lean on quantitative data. When blended, both approaches strengthen each phase of the product lifecycle.
Qualitative data in the discovery phase
During ideation or when unexplained friction emerges, qualitative analysis helps you hear the customer’s voice. Interviews, session replays and thematic analysis surface subjective experiences and underlying reasons for struggle. A single rage-click replay can reveal confusing jargon in a loan application, prompting a copy update long before it shows in churn numbers. By empathizing with human behavior, you ensure new features solve real problems instead of chasing vanity metrics.
Quantitative data for measurement and optimization
Once solutions launch, quantitative methods take center stage. Descriptive statistics track adoption, inferential statistics test hypotheses about the causal relationship between design changes and conversion, and A/B testing validates tweaks at scale. In a mobile banking app, you might monitor sign-in success rates and time on task to gauge whether biometric login delivers the promised efficiency.
Industry-specific use cases
Below are quick examples of how sectors blend both data types to achieve greater insight:
Retail and e-commerce: Heatmaps pinpoint drop-off on product pages (quantitative), then open-ended on-site surveys capture feedback on image quality or pricing (qualitative).
Financial services: Transaction flow metrics verify compliance throughput (quantitative), while follow-up interviews explore trust perceptions around data security wording (qualitative).
Insurance: Funnel analysis reveals quote-to-bind ratios (quantitative), and call-center transcripts expose confusion about policy exclusions (qualitative).
The power of mixed methods research
Mixed-methods research stitches these perspectives together, ensuring breadth and depth in every study. For example, you might survey thousands of users with Likert scale questions to measure satisfaction, then conduct a targeted case study with a handful of detractors to decode root causes. The triangulation accelerates problem resolution, validates product-market fit and supports predictive modeling for future releases. To see how AI accelerates this blend, watch our on-demand webinar on leveraging AI for CX insights.
With clarity on where each data type excels, the logical next step is unifying them so stakeholders act on one coherent narrative rather than juggling disparate reports.
Unified Data Approaches Create Stronger Customer Journeys
In an environment where even the smallest delay can push a customer away, relying solely on numbers or focusing only on anecdotal feedback means missing out on critical insights. Quantitative metrics are essential for spotting issues as they arise, while qualitative feedback helps uncover the reasons behind them. When both types of data are brought together, customer journeys become easier to understand, more seamless to navigate and ultimately more valuable to the business.
This combination brings clear advantages. Teams can detect problems quickly—dashboards may show a rise in abandonment rates, and session replays can pinpoint the confusing form field that caused it. With both statistical validation and direct customer feedback, decisions become more confident and better informed. Optimization becomes a continuous process, as AI surfaces patterns in both types of data and connects them to provide the full story behind customer actions.
Glassbox is designed for exactly this kind of unified approach. It captures every interaction without tags, organizes behaviors and sentiment through AI and places qualitative insights side by side with hard metrics. In a single shared view, product managers, analysts and compliance teams can align around what customers are actually experiencing.
If you want to see what this kind of insight can do for your business, explore our Customer journey analytics solutions. With Glassbox, you can turn qualitative and quantitative data into smart, decisive action that drives conversions, lowers churn and builds lasting trust across every digital touchpoint.


