
What is a Heatmap? The Complete Guide
A heatmap (or heat map) is a visual representation of what users are doing on your web pages, such as where they click or tap, how far they scroll and which elements they look at or ignore.


What are heatmaps?
Heatmaps, also referred to as heat maps, are one of the most well-known web analytics visualization tools. They’ve been in use for 20+ years. It has become such an industry standard that many RFPs for web analytics and digital experience solutions will explicitly require them.
The definition of a heatmap (or heat map) is a graphical representation that shows spots of activity or engagement on a website. Heatmap data shows what users are doing on each individual web page:
Where they click
How far they scroll
What they look at or ignore
Where they hover on the page
Where customers get frustrated on page
Which parts of your site are most engaging
Webpage performance on desktop, mobile, and tablet
Heatmap tools offer immediate visual appeal and a lot of useful information. Unlike traditional web analytics tools, they provide richer insight and are a great way to get a visual understanding of how and why to optimize your website.
If your landing page isn’t converting at the rate you expect, it’s likely there could be something wrong. Heatmaps can help you understand the issue. For example, you may discover on some devices the call-to-action (CTA) requires scrolling down the page. If visitors aren’t doing that, they’re missing it. So, you can move the CTA higher to ensure more people see it and thus drive more conversions.
Creating a heatmap helps determine where the most important content on a web page should be. They also help product, UX and marketing teams answer questions such as:
What page content do users typically see?
What are users interested in the most on a specific page?
Which actions are users taking the most?
Many departments across a business can use analytics tools like heatmaps to shine a light on the digital customer experience. From the moment a user lands on a webpage to the moment they eventually leave, the data they provide can help user experience (UX) teams understand what’s popular on a page (or not) and redesign the pages as needed.
But it’s not just for UX teams. Product teams can use heatmaps to look at aggregated data that shows how attractive a new feature is, and marketing can use them to see whether moving elements around, like banners or CTA buttons can increase conversions.
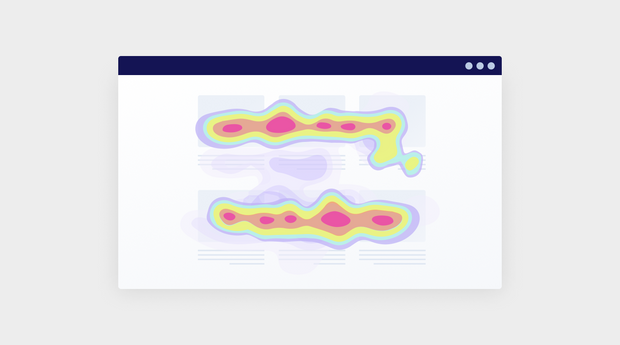
How do heatmaps work? How to analyze heatmaps
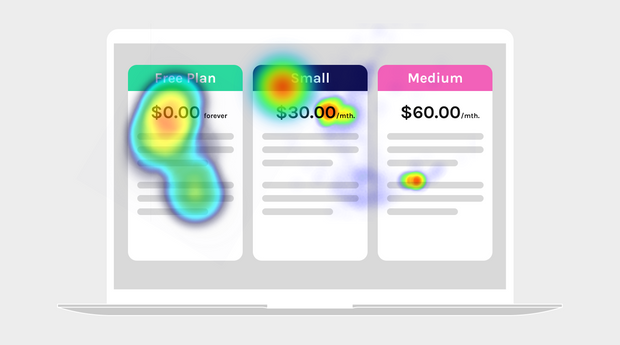
Heatmapping tools aggregate very large amounts of data and transform them into simple, immediate visual representations. Heatmap tools use a warm-to-cool color spectrum to visually represent which parts of your web pages receive the most activity and engagement.
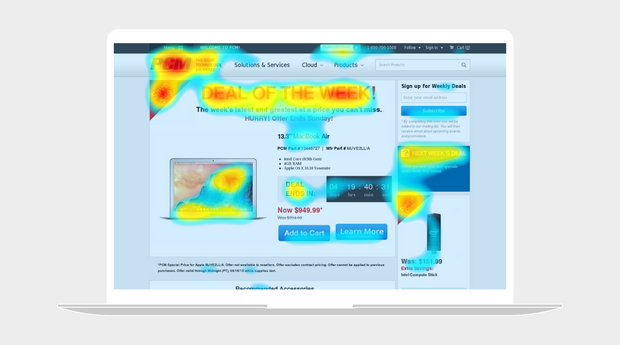
Typically the ‘hottest’ areas of a heatmap analysis are portrayed in red, fading through orange and yellow to ‘cooler’ areas in green, then blue. Some are portrayed in grayscale, and some will move through red to ‘white-hot’ areas.
It’s referred to as a color-coded overlay and works a little like this for most heatmaps:
Warm colors (reds and oranges) indicate areas with high user activity.
Cool colors (blues and greens) represent areas with less or no activity.
Transition colors (yellows and light greens) signify moderate levels of activity.
Color coding makes it much easier to see what’s actually happening on a webpage, from the collective actions of users. There are no complicated spreadsheets to scroll through. It’s laid out visually in a way that makes it easy to see where people are looking and what’s being ignored.
They immediately draw the eye to the hotter areas (or cooler areas depending on the purpose). The whole point of heatmaps is to tell you where to look for answers on what attracts your users, or not.
Heatmaps visually portray the scroll depth on a web page. The data shows that if users aren’t scrolling too far down the page, the CTA should be moved above the fold to align where users are showing the most activity or engagement.
Businesses and website owners can find the following information using heatmaps:
User engagement: Heatmaps show where users interact most, highlighting active areas.
Click patterns: They show user click distribution, indicating popular or even confusing elements.
Scroll depth: They display how deep users scroll, showing content visibility and engagement levels.
Attention hotspots: Heatmaps identify zones that attract the most attention, indicating user interest.
Since heatmaps can visually portray the scroll depth, the data can show when users aren’t scrolling down on a website or app. So an important CTA may be missed. UX designers can use this information to decide whether the CTA would be better placed above the fold, or whether to create content to entice the reader to scroll further.
Types of heatmaps
There are many different types of website heatmaps, and each one offers different insights. Heatmaps can be combined to see the full picture of what’s happening on a particular web page.
The most common types of heatmaps are:
Scroll maps
Mouse tracking maps
Click maps
Attention heatmaps
Desktop vs. mobile heatmaps
Scroll maps
A scroll map is a visual representation of a user's scrolling behavior on a specific web page. More specifically, this type of heatmap shows you exactly how far down the page your users are willing to go and where they spend the most time.
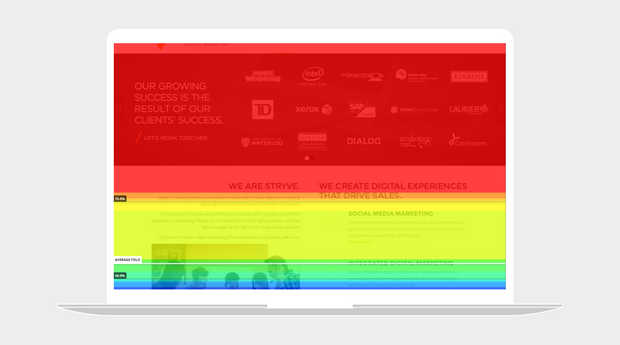
A scroll map can help you determine the length of your web page and how much content you should show users before they have to start scrolling. Web pages can be long - that’s normal.
A big conundrum in web design is always around how much content should be shown before users have to scroll. Scroll maps can help you identify where to put the most important content based on user activity and engagement.
Mouse tracking (move) maps
Mouse tracking maps, also known as move maps, display users' mouse movements on a web page and guide the ideal placement of content and CTAs.
These maps reveal what users view, what attracts them, and where they face difficulties. You can quickly identify and resolve friction points, making a better digital customer journey.
Click maps
Click maps show you where users click most often, or on a mobile device, where they tap. More specifically, click maps, referred to as touch heatmaps on a mobile device, show you data on which images, buttons, text or general page elements are being clicked on, as well as what’s being ignored.
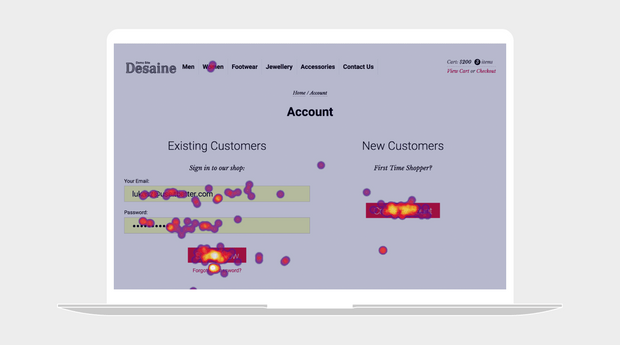
Click tracking not only identifies the most popular links on your web page, but also unclickable areas that users are trying to click on. Click map data can help you remove areas of friction on your website by either adding a link to areas users think should be clickable but isn’t, or redesign the area to make it clear that it’s not clickable.
This data is extremely helpful when testing your menus, promotional banners and CTAs. With proper placement, you can drastically increase your ROI.
There are also variations of click maps designed to give even more granular information about customer interactions including:
Error click maps
Error click maps show areas where users face frustration from non-functional elements. A user may have expected something to happen but found no response. Clusters of clicks on spots that lead to no result or an error message indicate you need to change something.
They identify broken links, unresponsive buttons, and faulty forms. Issues may stem from poor web design choices, or genuine user errors. The website team can use the information to fix the issues highlighted in error click maps.
Rage click maps
Rage click maps measure and visualize frequent, rapid clicks in a specific area, letting you know users are getting extremely frustrated. This often occurs when users expect a response from a page element, but nothing happens.
These maps are particularly effective in the following:
Highlighting unresponsive buttons or links: If a user is repeatedly clicking on an element without any action, it’s a clear sign there’s a usability issue at work.
Signaling slow loading times: Users may repeatedly click on an element as a result of slow response times.
Revealing navigation issues: If page layouts are confusing this can lead to navigation issues prompting users to randomly click as they seek the correct path.
Addressing issues from rage-click maps should stop users exiting the site prematurely. Solving these problems reduces frustration, lowers bounce rates, and boosts site performance.
Dead click maps
Dead click maps highlight areas where users frequently click, but no action is triggered. This could mean a non-interactive portion of the website looks like it should do something from the point of view of the end user.
For example, a decorative button that looks clickable but isn't functional can cause dead clicks.
UX designers use the data collected from dead click maps to create better on-page navigation and usability.
Dead click maps are valuable for optimizing conversion paths. For instance, many dead clicks on a checkout page suggest users struggle to complete purchases. This signals a need for redesign or clearer instructions.
Attention heatmaps
Attention heatmaps use color gradients to show areas of high and low user attention. They provide a visual or graphical representation that shows where users are focusing their attention or looking at within a specific visual like a webpage, image, ad or user interface. Attention heatmaps are used to understand and analyze user behavior.
The warmer the color, the more attention an area is receiving. Attention maps provide a more generous overview of engagement compared to the previous maps we’ve mentioned.
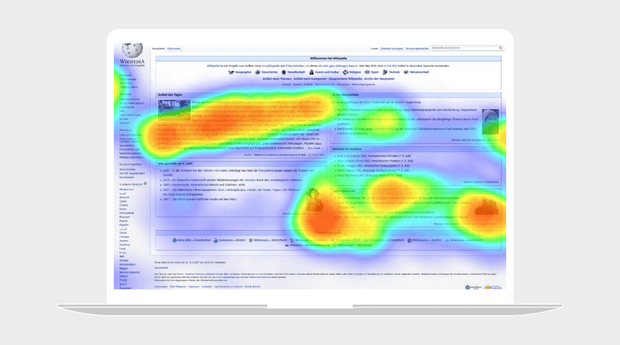
When you hover over different parts of an attention heatmap you’ll see a range of different statistics to gauge user engagement. This includes:
View percentage: The percentage of visitors who have seen this part of a web page.
Average engagement: Aggregates information on clicking, scrolling, and mouse tracking for a specific point on page.
Average time: The average time users spend interacting with a specific point.
For marketers, attention heatmaps help to determine how effective marketing materials really are. By understanding what captures users' attention, marketers can replicate high-performing ads across their website and elsewhere on the web.
Engagement zones
Engagement zone heatmaps combine different user interaction data. They track where users click, cursor movements, and scroll depth. This combination offers a fuller picture of user engagement than any single heatmap type.
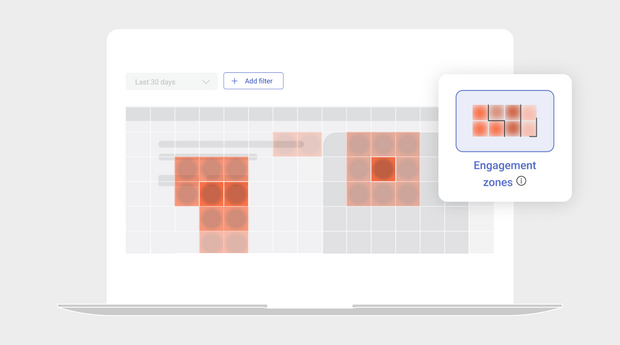
One of the advantages of engagement zone heatmaps is how efficient they are, even for non-technical users. Engagement zone maps combine data from click, scroll, and move maps and break the data down into a grid overlay. They allow for rapid web page analysis, showing areas of high and low user engagement at a glance.
Each block on the grid will show levels of engagement using a color system, just like other types of heatmaps. Blocks with moderate engagement are a light red and get darker the more engagement an area is receiving.
Eye tracking heatmaps
Eye tracking heatmaps track eye movements, pupil dilation, and blinking using sensors. Researchers or testers may conduct these types of heatmaps in a lab or through a user testing platform where participants use their webcams.
They pinpoint where a user's gaze falls on a web page, accurately measure visual attention and identify the most engaging parts of a page. This helps teams optimize content placement and design according to natural viewing patterns.
Eye tracking reveals design flaws not obvious in other types of heatmaps. For instance, if users often overlook key content, it suggests a need for redesign or repositioning.
Marketers and designers use these heatmaps to enhance ads, landing pages, and visuals. Knowing where users look on the page means moving the best and most compelling ads or content to prime position.
AI-generated maps
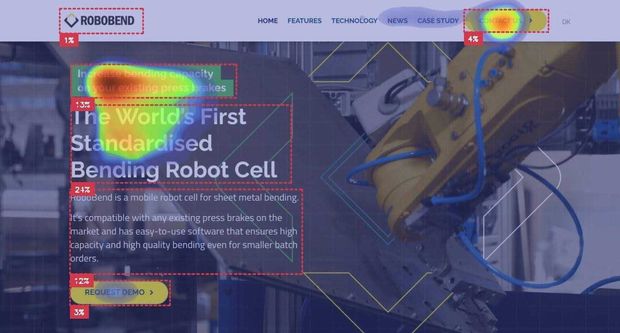
AI-generated maps apply machine learning to analyze patterns and predict webpage user behavior. They draw on vast datasets of user interactions to predict user behavior for the first 4-5 seconds on your website.
(Source)
Trained on eye-tracking studies using real people, the predictive algorithm will suggest attention patterns for a brand new web page. They have a 90-96% accuracy rate, so those working on a website have a solid foundation to make design changes to keep users on the page longer.
It’s most useful for deploying a new website or web page where you lack enough real customer interaction data of your own to generate heatmaps.
AI-generated maps are therefore a hypothetical map that mirrors human vision. Data is displayed in a similar fashion to attention heatmaps with a warm-to-cool color overlay.
Desktop vs. mobile heatmaps
Desktop and mobile heatmaps give you the ability to compare the performance and analyze both a user’s desktop journey and mobile journey. While desktop heatmaps show you how users are interacting with your website and the different web pages, mobile heatmaps show you how users are interacting with your app.
Mobile accounts for almost half of all internet traffic. People access web pages on the go and may make purchase decisions while browsing the web from their phone. In fact, 45.49% of all web traffic in the United States alone comes from mobile devices. So it’s important not to overlook this aspect of your brand's online presence.
Mobile heatmaps can show you how users are logging into your app. For example, whether they’re logging in with their Facebook or Google accounts versus their email address. If users are mostly logging in using their Facebook account, the data will show you this. You can then improve the user experience by making the Facebook login button more prominent than the Google account or email options.
Understanding behavior across devices helps to boost overall conversions. Just Right, a personalized dog food blend for Purina, a leading pet food researcher and manufacturer, learned that a majority of their customers were using mobile devices to access their site. By reimagining their website for the mobile audience, they improved the digital experience for 65% of their customers. This led to an 11.8% increase in conversions.
Benefits of using a heatmap
Heatmaps (or heat maps) provide many benefits, which we explore in more detail below.
Helps you answer important questions
A heatmap tool can help you answer some of the most important questions about your website, such as:
Are users struggling to find your CTAs?
How effective are your CTAs?
Is there content on your web pages that users are skipping over or just not seeing?
What are the most popular areas of a web page?
What page elements are distracting users and negatively impacting conversions?
Are there glitches or places users are mistakenly clicking?
Where are there opportunities?
According to PwC, 32% of customers would stop doing business with you after just one bad experience, even with a brand they love, On the flip side, customers are willing to pay up to 16% more for a great experience. By answering (and addressing) the important questions listed above, your website or app will provide a better experience and grow loyalty among visitors.
Allow you to make data-driven decisions
Instead of guessing why your users aren’t converting, heatmap reports give you the ability to make data-informed decisions. With the data from heatmaps, you’re able to form a deeper understanding of user behavior and make adjustments to your website.
For example, if users are continuously skipping past your CTA, a heatmap will show you this. It could mean they’re struggling to find your CTA or imply that the CTA isn’t effective. Either way, you won’t be left guessing and can make necessary changes to improve conversion rates.
Provide insight into UX design
Once you get answers to the questions above, you’ll have the data you need to start optimizing your UX design and web pages. Below are examples of things you can test out:
Get each page working effectively across all devices and operating systems
Correct any bugs in your code
Ensure all page elements are present and load promptly
Change the order and location of key messages and CTAs
Optimize the size and positioning of images and text
Tighten or shorten your copy
Replace large amounts of text with a short explanatory video
Apply different color and contrast combinations to attract or deflect attention as required
Offer live chat or pop-up help and better locate error messages so you don’t lose users to frustration
Remove all distractions from vital web pages at the end of the funnel, such as checkout
Provide clearer instructions or add FAQ/help pages or pop-ups
Enlarge or redesign important buttons and repeat them in key locations
Adopt a format for form fields that users feel comfortable with
Interpret user behavior and adjust the web page accordingly
Sainsbury’s, a leading UK retailer, found that nearly 48% of its customers were exiting the funnel after selecting a specific delivery option. By identifying and fixing the issue, they were able to enhance the user experience and recover $200k in revenue per quarter.
Enable teams to use the data to push for change from other stakeholders
As mentioned above, heatmaps allow you to make data-informed decisions. The data takes the guesswork out of what should be changed on a website and helps teams prioritize the changes that need to be implemented to provide a seamless digital customer experience.
Heatmaps provide strong visuals to help you prove your point and get buy-in for your business case. It’s difficult for stakeholders to argue with the data presented by heatmaps.
Improve the customer experience
Building a website isn’t a set-it-and-forget-it exercise, especially if it’s the main driver of your company’s revenue. Individual user behavior is constantly changing, so what may have worked in the past may not be effective today.

As of 2024, businesses conduct 28.8% of all transactions online, and this percentage is growing year on year. Understanding user interaction through heatmaps can mean the difference between success and failure.
The only way you can truly provide a great digital customer experience is to understand your audience and how they interact with your content so that you can optimize your website in the best way possible. A heatmap tool can help you understand the changes that need to be made and prioritize them.
Boost conversion rate optimization (CRO) and improves conversion rates
CRO is the science of continually making your website work harder for you. Your website has to keep improving on an ongoing basis. After all, your competitors are busy fine-tuning their own digital customer experiences and new competitors are always emerging.
No matter how great your website is, there could be all kinds of things adversely affecting users’ interactions with it. Many of these things are within your control, so it’s critically important to identify and fix them.
For example, when asked in 2023, 73% of consumers expected a more personalized experience if they opt to share data with a business. Doing so helps to speak directly to the interests of the individual.
If this is something you’re not doing, you’re most likely missing out on revenue or other gains, while also wasting the money you spent on advertising and promotion to get user attention in the first place. If you’re losing customers who came to your website ready to buy but then were prevented from doing so, that’s a huge issue. Not only are you losing sales, but you are losing market share and aspects of your reputation as well.
Identify usability issues, such as rage clicking
When visitors encounter usability issues on your website, such as bugs or broken elements, or even an element that appears it should be hyperlinked but isn’t, they begin to rage click.
If you notice one or more of your web pages has a particularly high bounce rate, you can create a heatmap to find out why. Heatmaps can help you identify usability issues so that you can fix them and prevent further frustration.
Who can use a heatmap?
Heatmaps play an important role across many teams and departments. Each has their own area of expertise, and here is how they use heatmaps:
Digital marketers: Digital marketers use heatmaps to understand which areas of the page are attracting visitors, which are ignored, and which might prevent conversions.
Digital analysts: These professionals rely on heatmaps to better interpret user behavior and website performance.
UX designers: UX designers use heatmaps to improve page design or test changes for intuitive, user-friendly interactions.
Developers: Developers rely on heatmaps to identify website technical issues, such as unresponsive buttons or links.
Customer support teams: These teams use heatmaps to understand common user issues or areas of confusion on a website.
Product teams: Product teams use heatmaps to gauge user interaction with different page or application features.
Sales teams: Sales teams can benefit from heatmaps by understanding how potential customers interact with product pages or promotional content.
How to create a heatmap—tools and software
There are many heatmap software tools available, including:
Adobe Analytics: Offers comprehensive analytics, including detailed heatmaps.
Crazy Egg: Known for its user-friendly interface and easy setup.
Inspectlet: Specializes in session recording and offers detailed heatmaps.
Lucky Orange: Provides dynamic heatmaps, session recordings, and surveys.
Mouseflow: Offers user behavior analytics with features like session replay and various heatmap options.
Smartlook: Combines quantitative and qualitative analytics.
Zoho PageSense: A conversion optimization and personalization platform.
Glassbox: provides the digital customer experience through heatmaps and more, with interaction maps and in-page analytics.
Before you decide on heatmap software, read below to see how an interaction map can provide even more insight into your analytics goals.
Limitations of heatmaps
While heatmap tools are widely used to understand user behavior on websites and mobile apps, they are not the end-all, be-all.
We discuss three known limitations heatmap software tools suffer from below.
1. Precision
Heatmap software typically show colors instead of numbers. Sometimes you need a more granular breakdown or absolute numbers. The same goes for scroll depth.
2. Accuracy
Heatmaps rely on x and y pixel coordinates. This means if the size of a web page changes and the buttons move, the colors won’t be accurately mapped to where users really clicked. This is why many heatmaps show lines of color where users are clicking as the page stretches in width.
3. Flexibility
Modern websites are dynamic, with different content displayed based on user behavior, such as accordions and tool tips. An accordion is a type of menu that expands or hides content based on the heading the user selects. Heatmap software relies on manually configured page states to account for these changes, but a complex page can have thousands of possible layouts making it difficult to accommodate using a few page states.
In practice, this means heatmaps are best for making high-level presentations about basic web pages. For example, think of design agencies embedding screenshots into an executive presentation for a site that sells auto insurance.
What if you want to track trends in engagement or the impact of design changes on a specific element? Or do you have an interactive responsive website radically altering the layout of elements on different devices based on user actions? Then you might want to consider an interaction map.
Interaction maps
Interaction maps take heatmaps to another level by displaying numbers and percentages in addition to color mapping engagement for more granular data. They rely on interactions with specific elements rather than mapping pixel coordinates for greater accuracy and flexibility. This overcomes the limitations of heatmaps, but at the cost of having to work a bit harder to understand the visualization.
More advanced interaction maps will also include metrics, such as:
First clicks
Struggles and their impact on revenue
Changes to form fields
Click rate
Focus time
This enables you to answer meaningful questions, such as:
Where do users struggle?
Which fields are clicked on but not filled out?
In what order do users navigate the page?
What is the impact on revenue for each page or screen element?
They will also support single-page applications and native mobile apps, saving you the headache of deploying multiple tools. The ultimate interaction maps will also integrate with a journey map view and session replay, resulting in a heatmap recording. This is what a full suite digital experience solution will offer.
What’s next?
Heatmaps are a highly useful visual tool to quickly understand how users behave on-page. But to truly see, analyze and manage the total digital experience, you need to understand how users perceive your brand every step of the way..
That means understanding all their digital touchpoints. What is their experience navigating your app or website, what frustrations do they face and what leads them to purchase online and become an advocate for your brand?
To get enough information to do that, you need insights that help you understand how each element of a page impacts user behavior. That requires more data than can be provided in a heatmap.
You can combine heatmaps with other types of analytics, drill down into individual user sessions, or combine them to get data from all the users who took the same specific steps during their journeys. Learn more about how you can optimize your website or mobile app by understanding how customers engage with you online.
FAQs
Check out the heatmap FAQs if you’re short on time or are looking for a quick cheat sheet.
Heatmaps are visual tools that represent data graphically, depicting values by color. They make complex data easy to understand at a glance.
An example of a heatmap is a click map on a website. It uses shades of color to show where users click the most. The darker or more intense the color, the more clicks that area receives.
A heatmap conveys visual representations of user reactions on web pages. They provide insights into visitor behavior, such as clicks, taps, scroll depth, and engagement levels.
Google Analytics itself does not provide heatmap functionality. However, there are third-party tools that integrate with Google Analytics to create heatmaps.
A hot spot refers to a specific area of high user activity or engagement on a webpage. In contrast, a heatmap is a broader tool that visualizes data across an entire webpage or set of pages.


