
Funnel Analysis: Find and Fix Drop-Offs Faster
Not every prospect will become a customer. However, low conversion rates could indicate you have a “leaky” marketing funnel. Prospects are dropping off at various customer journey stages before they convert.
The good news is that you can plug the leaks in your funnel and recover more sales. How? By conducting a funnel analysis—a method that reveals bottlenecks in the customer journey.
In this in-depth guide, we’ll cover:
What funnel analysis is and the benefits of conducting
Different ways you can use a funnel analysis
How to get useful insights and steps to getting started
What is funnel analysis?
Funnel analysis is a method used in marketing and analytics to understand and optimize the steps that users or customers take during their journey toward a specific goal or conversion. The term "funnel" refers to the sequential stages that users go through, starting from the initial awareness stage to the final conversion or desired action.
What's the purpose of funnel analysis?
The primary purpose of funnel analysis is to identify and address bottlenecks or areas of improvement within the conversion process. By tracking and analyzing user behavior at each stage, businesses can gain insights into where users drop off, lose interest or face obstacles that prevent them from progressing further. This information helps businesses optimize their marketing strategies, user experience and conversion rates
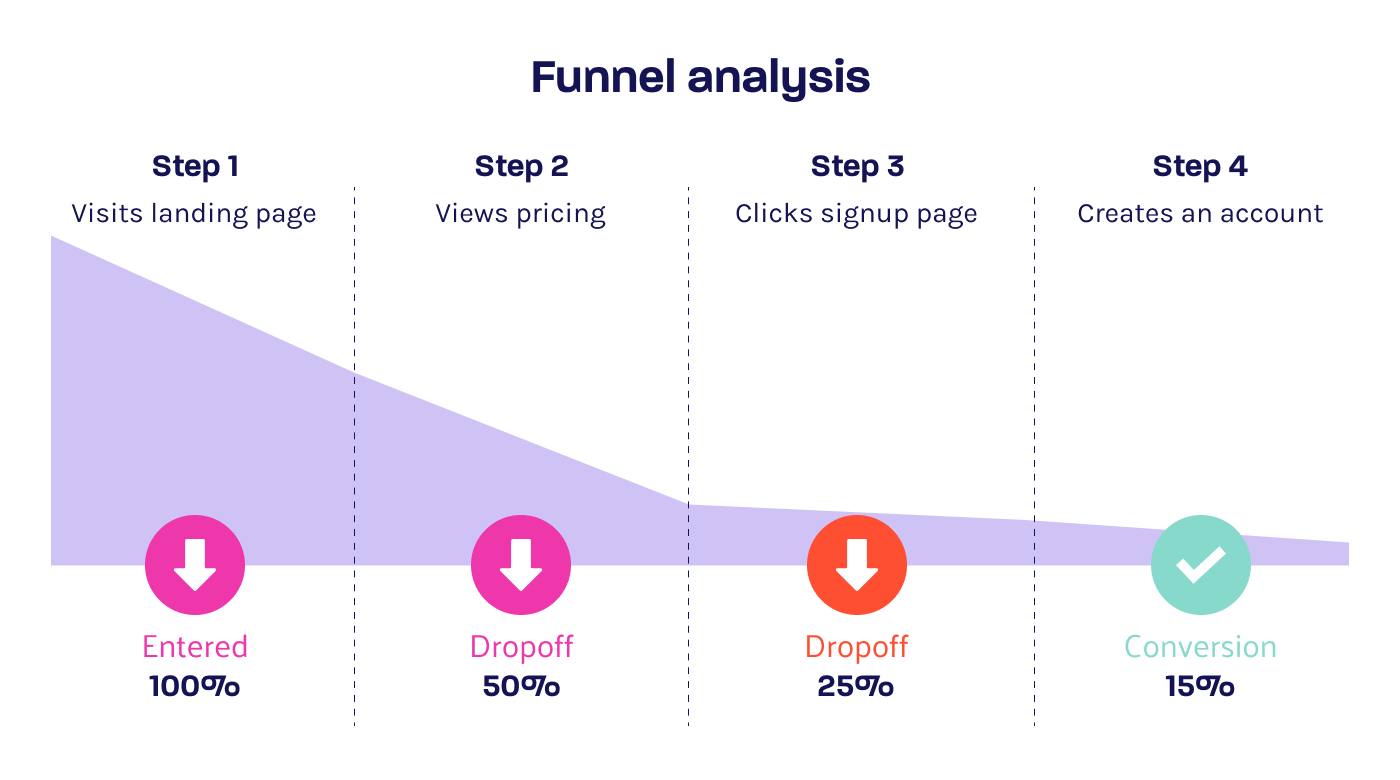
For example, let’s say conversion rates for your signup pages are below the average rate of 4.3%. (Note that the average conversion rate is different for different industries, and you should know the benchmark rate for your own industry, the rate you want to beat).
Analyzing how users progress from one stage in the funnel to the next can help you understand why your conversion rate might be low. Maybe users can’t enter their email addresses due to a technical issue, or the page isn’t optimized for mobile devices. These issues can cause users to drop off, but without a funnel analysis, it’s hard to know for sure.
What are the benefits of a funnel analysis?
All digital customer journeys can benefit from funnel analysis. Some funnels are 3-4 steps, while others are much longer. For instance it could be a simple conversion funnel to go to a website, watch a short video and fill out a contact form. Or a funnel could involve more decision points, like a purchase. See below for an example.
A visitor takes the following steps:
Step 1: Goes to the website
Step 2: Clicks to a product page
Step 3: Adds that product to the shopping cart
Step 4: Clicks to the purchase checkout page
Step 5: Fills out the purchase form
Step 6: Completes the purchase
Conducting a funnel analysis allows you to:
Find drop off and friction points
Funnel analysis allows you to pinpoint specific stages where users are dropping off or experiencing difficulties. No matter whether it’s signing up for a trial period, requesting a demo or putting items in a shopping cart. Knowing when and where (and why) potential customers are leaving your website is critical data. By analyzing these bottlenecks, you can identify the reasons behind the drop-offs, such as confusing navigation, lengthy forms or technical issues. This insight enables you to optimize those stages and improve overall conversion rates.
Optimize user experiences
Understanding the user journey through funnel analysis helps you gain insight into how users interact with your website or mobile application. By analyzing user behavior, you can identify pain points, user preferences and areas where improvements can be made to enhance the overall user experience. This information can guide design changes, content improvements and feature enhancements.
Reveal technical errors
Drop-offs happen for many reasons, but one you may not know about until funnel analysis is technical errors in one or more steps. For example, if you’re getting a big drop-off at the last step, it could be that the link is broken or is directed to the wrong page. Or if users are backtracking in the funnel flow to the prior step, that indicates an issue.
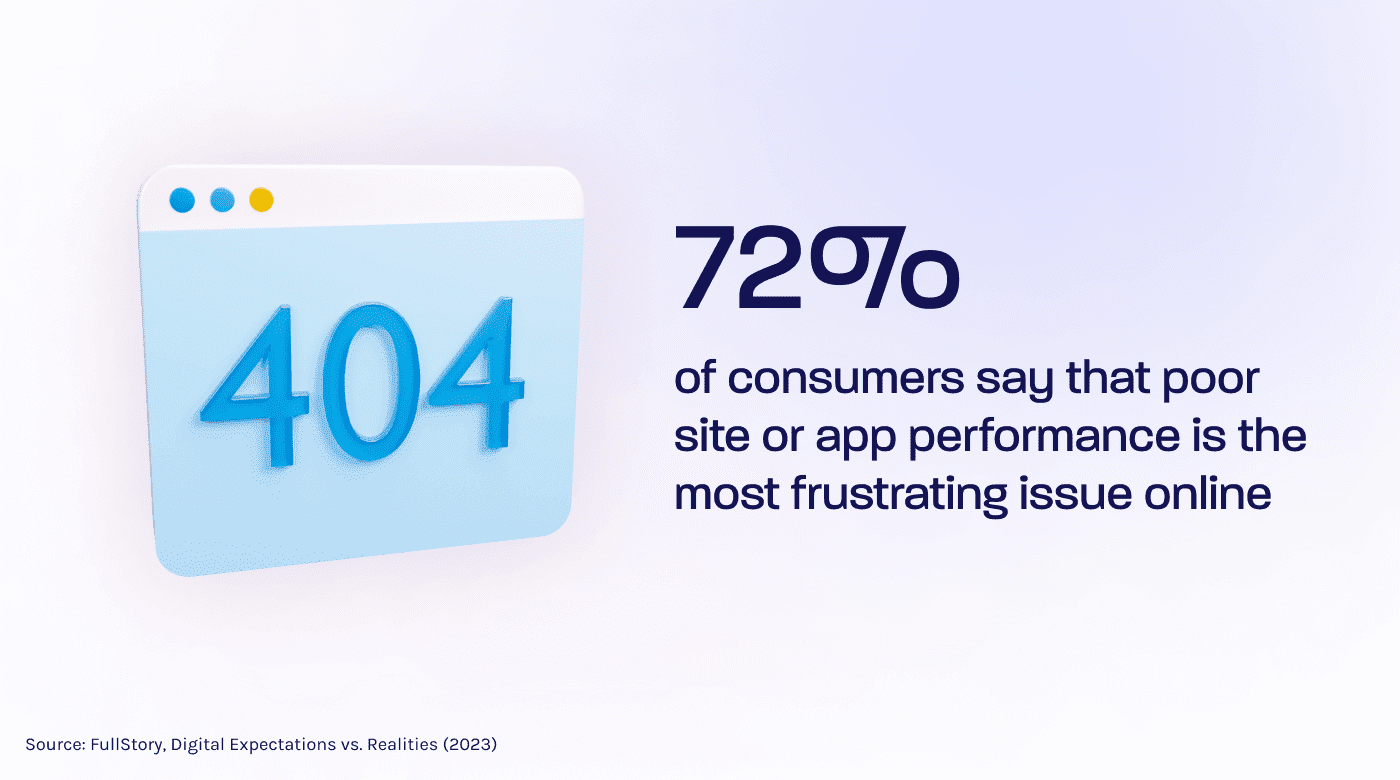
Identifying and addressing these issues should be a top priority, especially since 72% of consumers say that poor site or app performance is the most frustrating issue online.
Make iterative improvements and data-led decisions
Funnel analysis provides a data-driven approach to decision making. By continuously analyzing, understanding and optimizing the user journey, you can make informed decisions based on real user data rather than assumptions. This iterative improvement process helps you make data-driven decisions to enhance user engagement, increase conversions and achieve your business goals.
Understand visitor demographics
Another important benefit of funnel analysis is surfacing who your potential buyers and customers are. Analyzing the sales funnel through the demographics lens can elicit powerful data to segment your audience into personas or different audiences. You can learn who your highest-converting customers are, create a different decision flow for certain segments or make other enhancements that leverage insights about specific groups of visitors.
Refine your messaging
A funnel analysis can help determine how well your messaging resonates with your audience. For example, if prospects are dropping off in the evaluation stage, adjusting your message to better convey the value of your product could increase engagement. Examples include testing new headlines, revising your call-to-actions (CTAs), or optimizing your forms.
Validate your designs
Over three-fourths of consumers (77%) say their top priority when transacting online is quickly accomplishing what they set out to do. Analyzing how users flow through your funnel and interact with your platform can help your product team evaluate how intuitive it is. It can also provide insights into the impact of new design changes on user behavior.
7 ways to use a funnel analysis
Customers who leave your funnel obviously won’t convert. And research shows that 54% of consumers will stop using a brand after a single bad experience. The average churn rate—the percentage of customers who stop doing business with a company—across all industries for software businesses is 4.1%. Customers who leave your funnel obviously won’t convert.
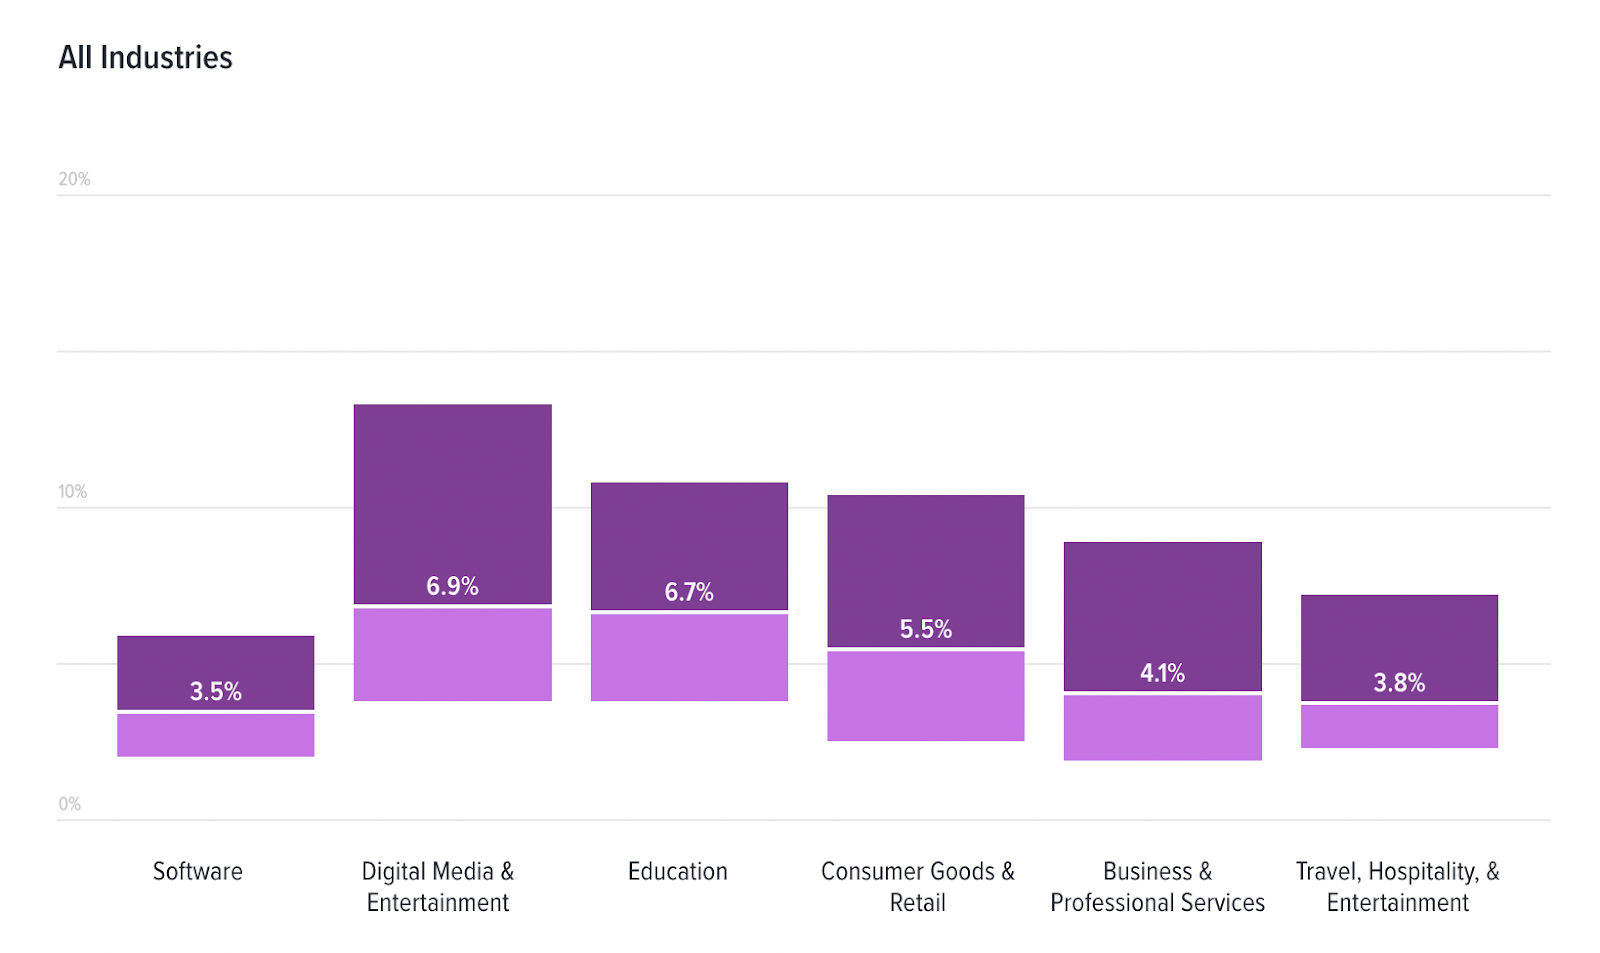
Funnel analysis is a powerful tool with diverse applications. Here’s how to use a funnel analysis to both minimize churn and optimize the customer journey.
1. Increase conversion rates: Analyzing digital funnels can help find answers to get more conversions and reduce churn. It could be that you reduce or eliminate pop-ups along the way, show pricing upfront in the shopping cart, cut a step altogether or otherwise refine the flow. These all add up to an overall better experience for potential customers.
2. Optimize the customer journey: Conducting analysis for all of your website or app funnels can shape decision-making throughout the customer journey. Taking a holistic view, you can use this analysis to optimize each step of the user experience and make it easier for users to engage and convert at each touchpoint.
3. Measure marketing effectiveness: By analyzing how users move through your funnel, you can determine which marketing campaigns are most effective for driving conversions. This can help you optimize your marketing efforts and allocate your resources more effectively.
4. Identify trends in user behavior: Funnel analysis can help you evaluate trends in your visitors’ behavior, such as fluctuations in the conversion rate, or how much time users spend navigating through each funnel step. These insights can help you make data-driven decisions about your website or app's design and functionality.
5. Monitor performance over time: By tracking your funnel over time, you can monitor your website or app's performance and identify areas where it may be underperforming. According to Forbes, 47% of users will leave a website that takes more than 2 seconds to load, and a mobile site no more than 3 seconds. seconds.
And it’s not just time performance—61% of users expect to find what they’re looking for in under 5 seconds, so navigability certainly matters. Understanding whether users are dropping out out of your funnel due to performance issues can help you make proactive changes to improve your conversion rate and overall user experience.
6. Monitor user behaviors across different devices: An estimated 76% of US adults reported using a smartphone to shop online, while 69% have used a desktop and 28% have used a tablet. A funnel analysis can help you understand how the user experience varies across different devices, enabling you to optimize your strategies accordingly.
7. Guide your A/B testing efforts: A/B testing shows your users two versions of a web page and compares the results. The version that converts more users “wins” the test. Conducting a funnel analysis can help you develop a hypothesis and test different strategies to move more prospects to the next stage.
How to choose the right tool for completing a funnel analysis
The real power of funnel analytics lies beyond displaying the number of users progressing through a predefined flow. Google Analytics for instance can show the drop-off count at each step, but it doesn't provide the underlying reasons. Advanced tools, such as digital experience intelligence, provide the insights required to identify the root causes of problems and the additional context required to prioritize based on impact. Access to this level of insight enables faster issue resolution.
Here are some key features to look for:
Session replay captures the entire interaction the visitor went through on your website. Session replay is critical in identifying bugs, user struggles and UX design flaws. You can pinpoint sections to see clicks, keyboard entries, mouse movements and other actions. For mobile users, you can review their every tap, scroll, pinch and more.
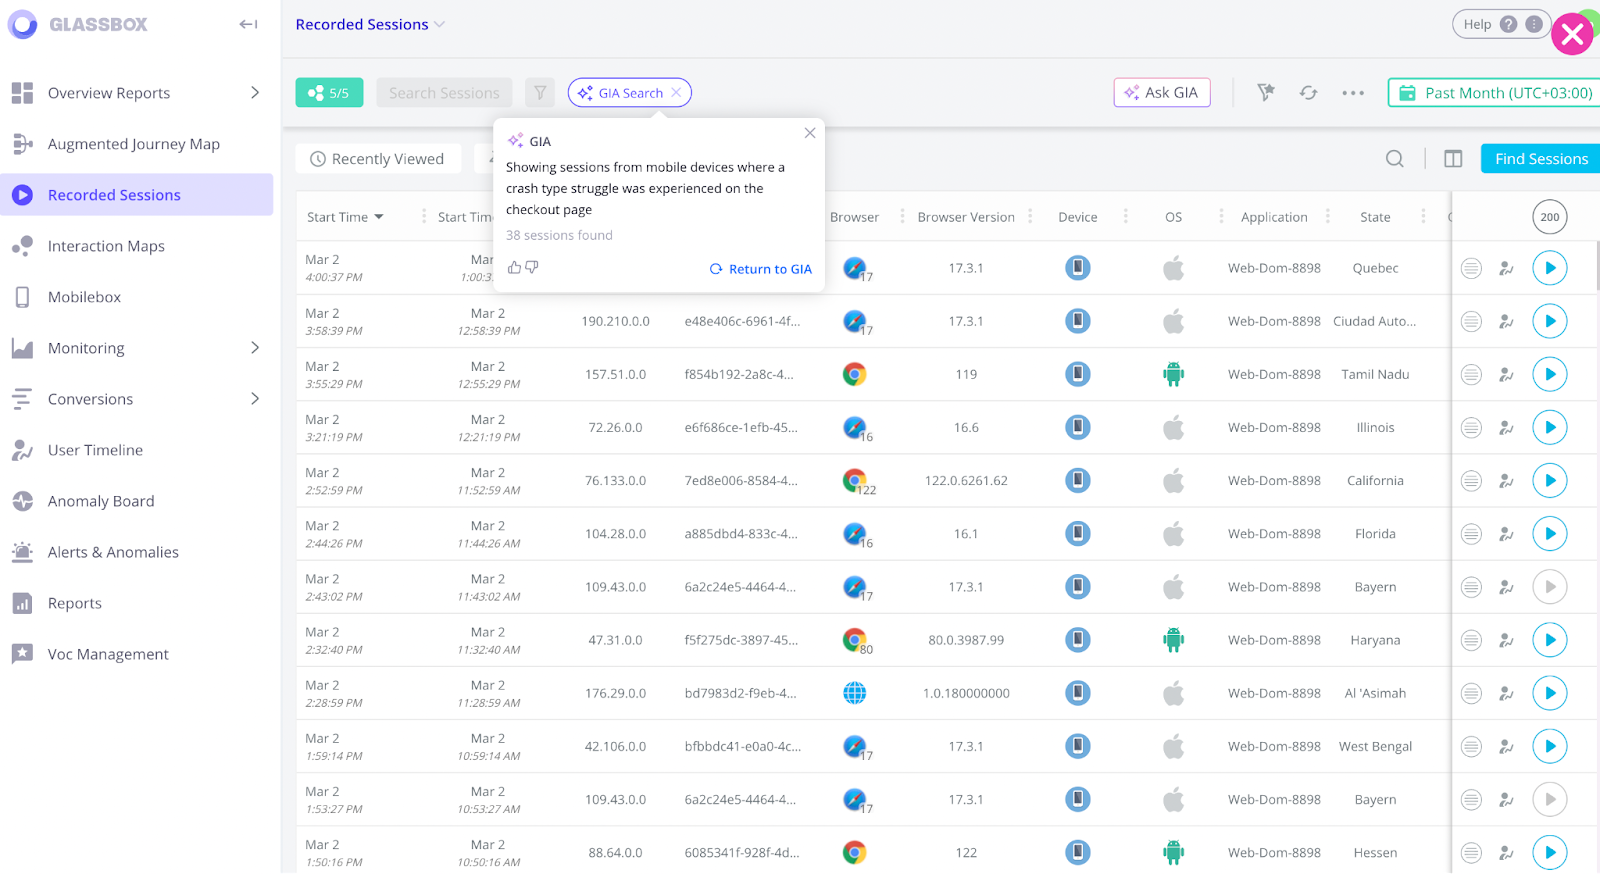
Keep a look out for advanced functions where funnel creation is possible from within the session replay window itself.
Heatmaps are a well-established and popular web analytics tool. They provide a visual representation of the visitors’ activity and engagement on a website. There are many types of heatmaps. The most common ones are scroll maps, click maps and move maps. There are also mobile heatmaps to get a drill-down visual view of app activity.
Struggle analysis lets you identify friction points in different customer journey stages. It can alert you of potential issues like rage clicks, which often indicate errors like bugs, broken elements, and dead links.
Voice of the Silent (VoS) is another key feature to look for in a funnel analysis tool. It uses machine learning and natural language processing to help you understand how your users actually feel—something that’s not easy to gauge, considering that just 4% of users leave survey feedback.
VoS turns interactions across all sessions into quantifiable feedback, giving you a clearer picture of user sentiment. You can find, prioritize and fix sources of friction users experience without asking a single survey question.
Other advanced capabilities that enhance digital analytics insights:
Tagless data capture automatically tags every digital interaction, saving time and resources
Anomaly detection: Allows you to receive notifications if any behaviors deviate from normal patterns.
Retrospective analysis: By utilizing a tool with retrospective analysis, users can effectively explore and analyze data to gain valuable insights into past occurrences. No more waiting for your funnel to gather data--view the data from that specific funnel the second you hit publish
Revenue impact analysis provides a view as to the financial impact abandonment is having on your business
Browser and device analysis provides the context you need when investigating the cause of issues leading to funnel abandonment
Integration with third-party solutions boosts insights and relevance from your analytics
Privacy and compliance features to protect sensitive data and increase security
How to get useful insights from funnel analysis
You’ve set up your funnels, they’ve been live for a certain amount of time and it’s time to evaluate how they perform for engagement and conversion. Funnel analysis will give you the insights to start making improvements. You’ll be asking questions like:
How many users completed each step of the funnel and did they finish?
Was there a pattern in visitor drop-off behavior?
How long does the funnel take to get through?
Is this data that would benefit from A/B testing to further evaluate results?
This is where advanced digital analytics show their strength, saving time and effort while delivering actionable insights. Beyond drilling down into the data, you can quickly interpret user behavior, identify the root cause of struggles and errors, prioritize improvements by their business impact or segment specific audiences to learn more about their behaviors. Altogether, these features help you come to data-driven decisions for a better user experience–redefining what success looks like.
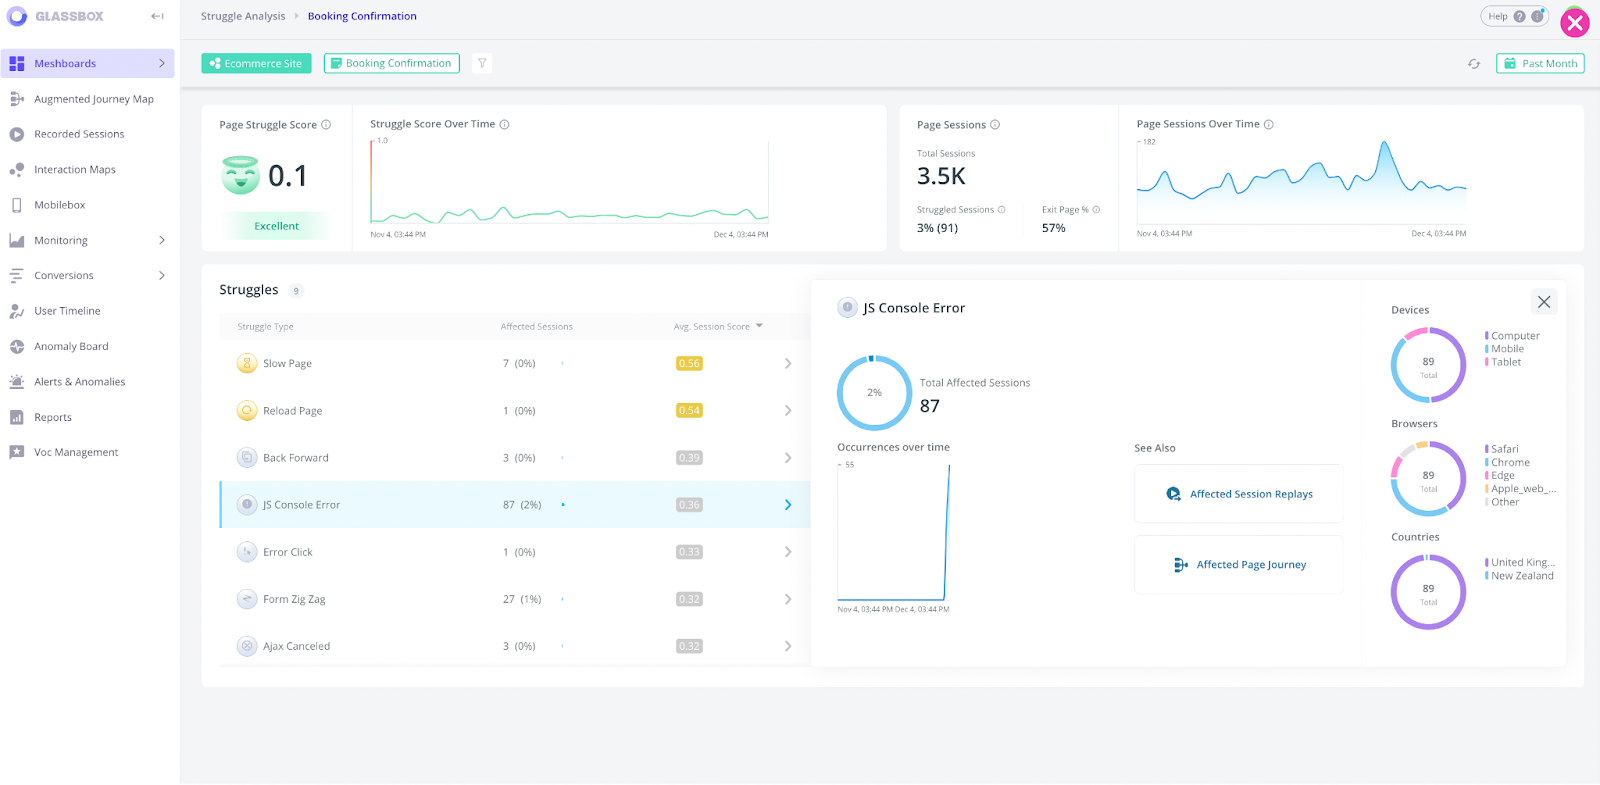
Here are some common examples of how using heatmaps or interaction maps, session replays and other digital analytics insights can lead to decreased abandonment and increased engagement and conversion:
Removing steps in the funnel
Change the order and location of key messages and CTAs
Swap large amounts of text with a shorter copy
Add pop-up windows or hovers for explanatory text
Change a form field from required to optional
Expand ad campaigns to increase funnel entry points
Real-world examples of using a funnel analysis
Below, we’ll examine how two companies conducted a funnel analysis to optimize customer journeys and generate more conversions.
Recovering more than £200,000 in revenue per quarter
Sainsury’s is a major retail corporation in the UK. The company discovered that 47.7% of its customers were dropping off at the checkout page, but it wasn’t clear why.
Conducting a funnel analysis revealed a technical issue. Customers couldn’t click an option to buy and collect a product in-store, causing many to simply exit the app.
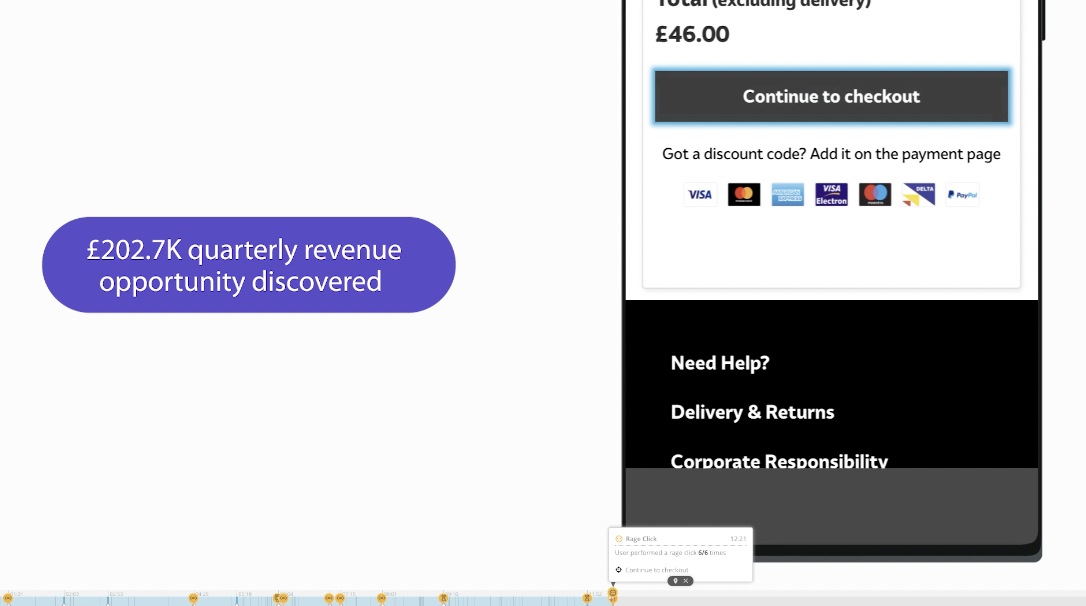
After identifying and fixing the issue, Sainsbury’s recovered over £200,000 in lost revenue per quarter. Not only that, they were able to reduce costs and certainly improve the user experience.
Getting online bookings back on track with the help of funnel analysis and session replays
Classic Vacations is a luxury wholesaler of vacation rentals.
Agencies use their tools to book travel packages from resorts around the world. However, the product team noticed revenue was down 86% weekly. Their first step was identifying where users struggled in the checkout process.
Viewing session replays showed that users were stuck in the “Show property details” step. Details about vacation properties weren’t displaying properly, so agencies couldn’t complete their bookings. After identifying and fixing the issue, Classic Vacations was able to bring bookings back on track.
Getting started with funnel analysis
Follow these steps to get started with funnel analysis.
Define your strategy and goals: Clearly define the objectives you want to achieve with your website or mobile application. Identify the key actions or conversions that align with your business objectives. For example, it could be completing a purchase, signing up for a newsletter or filling out a form. Your funnel strategy will, of course, be driven by your industry, specific business goals and marketing tactics. But there are some common funnel requirements for all digital journeys that narrow the scope as you map out your funnel. Here is a sampling of questions that may be asked:
What do you want your visitor to do at the end of the conversion funnel?
What are the funnel metrics you’re tracking? (volume, churn, conversions, etc.)
Is it a B2B play nurturing for the long haul or fast B2C, like a travel purchase?
What audience segment is for this funnel? (prospect, new customer, returning customer)
Is the funnel nurturing leads in the sales pipeline?
Does this visitor need more education before making a purchase?
Does the visitor need social proof as part of the conversion journey?
…and many more.
Map out your funnels: Identify the critical user journeys or flows that lead to your defined goals. Break down these journeys into stages or steps, starting from the initial interaction to the final conversion. Each stage represents a milestone in the user's journey, such as a landing page visit, product selection or checkout process.
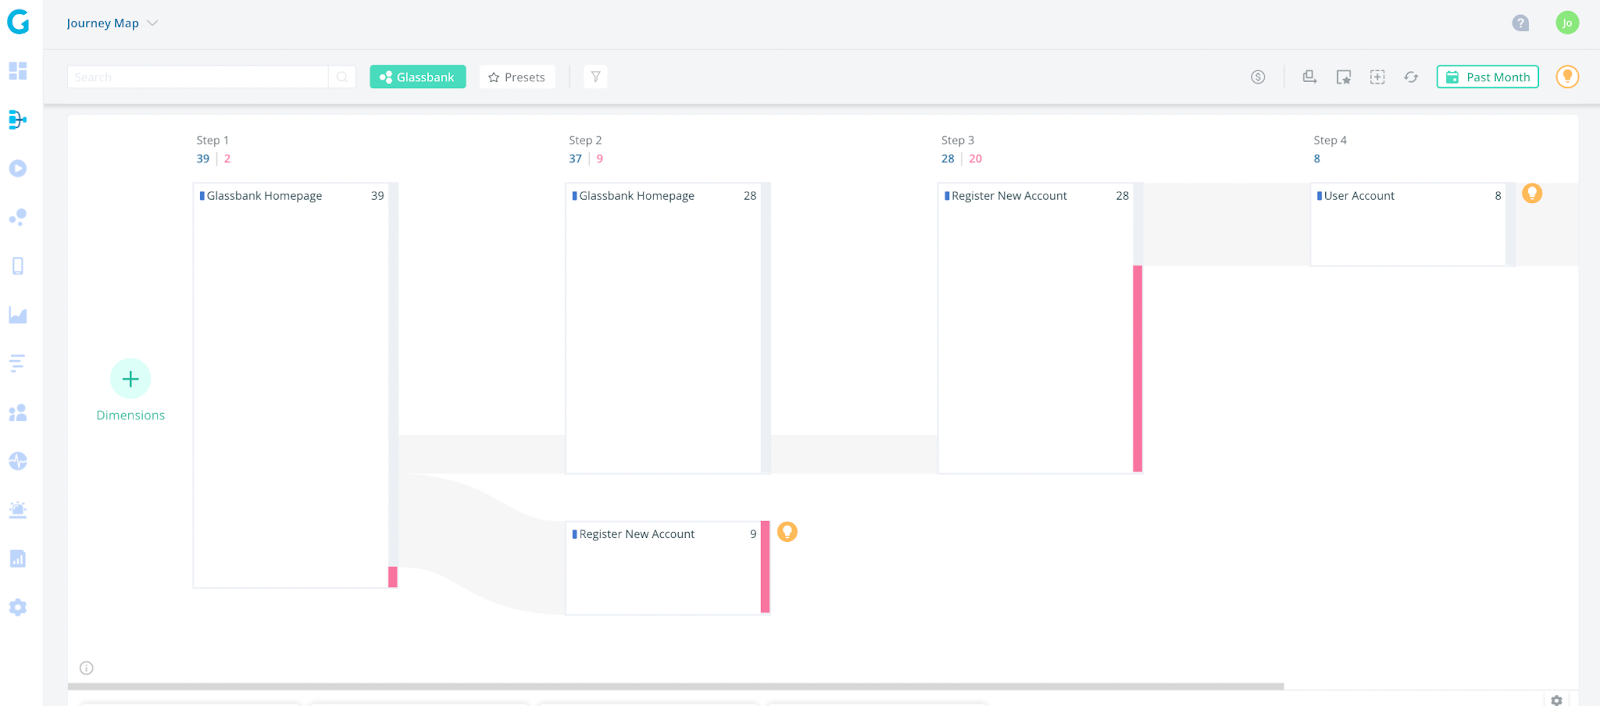
Set up tracking: Implement a robust analytics system to track user behavior at each stage of the funnel. Use event tracking, page view tracking or other relevant tracking methods to capture user actions and interactions. Ensure that the tracking is accurately implemented and aligned with your defined goals and funnel stages.
Analyze user behavior: Collect and analyze data from your tracking system to gain insights into user behavior within the funnel. Examine the conversion rates at each stage, identify drop-off points and understand user flow throughout the journey. Look for patterns, trends and areas of improvement.
Identify bottlenecks and optimization opportunities: Based on your analysis, identify stages in the funnel where users are dropping off or experiencing difficulties. Investigate the potential causes, such as usability issues, confusing navigation or technical errors. Use this information to optimize those stages and improve overall conversion rates.
Iterate and test: Continuously monitor and analyze the performance of your funnels. Implement A/B testing, user feedback or usability testing to validate improvements and iterate on your optimization efforts. Make data-driven decisions to enhance the user experience and maximize conversions.
Measure and refine: Regularly track and measure the performance of your funnels. Use key metrics such as conversion rates, drop-off rates and average time spent to evaluate the effectiveness of your optimizations. Refine your funnels based on the data and insights gathered, aiming for continuous improvement.
Pro tip: Use funnel alerts to stay informed about conversion rate changes. Act swiftly during issues and learn from positive improvements.
Now what?
Any business can benefit from a funnel analysis, which can uncover potential bottlenecks in the customer journey, and what’s serving you well. Of course, you need the right tools to help you understand how users move through your funnel.
Glassbox’s digital experience intelligence (DXI) shows how users interact with your product. It automatically captures 100% of all digital events across your site and app, giving you the data you need to make data-driven decisions.
In addition to funnel analysis, you can read more here about all the ways you can achieve digital experience excellence.
FAQs
What is funnel analysis?
Funnel analysis maps out and analyzes the journey your visitors go through on your website or app to understand which parts of the funnel are working well or need improvements. These insights can be used to optimize the funnel to increase traffic, convert visitors and retain customers.
What are the benefits of funnel analysis?
There are many benefits to conducting funnel analysis. Some major ones include:
Finding areas of friction and abandonment in the funnel to correct them
Uncovering hidden technical issues that you were unaware of
Understanding your audience personas and segments so you can better address their needs
How can funnel analysis be used as part of your digital strategy?
Funnel analysis can be used to:
Help increase conversion rates and reduce churn
Optimize the customer journey to make it easier to engage each step of the way
Measure marketing effectiveness to see which campaigns drive conversions
Identify behavior trends such as conversion rate fluctuations, time spent on pages, etc.
Monitor performance over time to track areas that are underperforming or working well


