What Is Mobile Analytics? The Complete Guide


Examples of mobile analytics
Mobile analytics involves any data your app gathers about your mobile users' performance or how mobile users interact with it. Common examples include:
Web analytics
App performance and usage
Click-through rates
Retention rates
Demographic info of signed-up users
Traffic sources (for mobile websites)

Glassbox interaction maps show how far users scroll on mobile app screens.
How do mobile app analytics work?
Gather relevant data. Using a digital experience intelligence platform like Glassbox, you can automatically capture information about app performance, user engagement and user behavior.
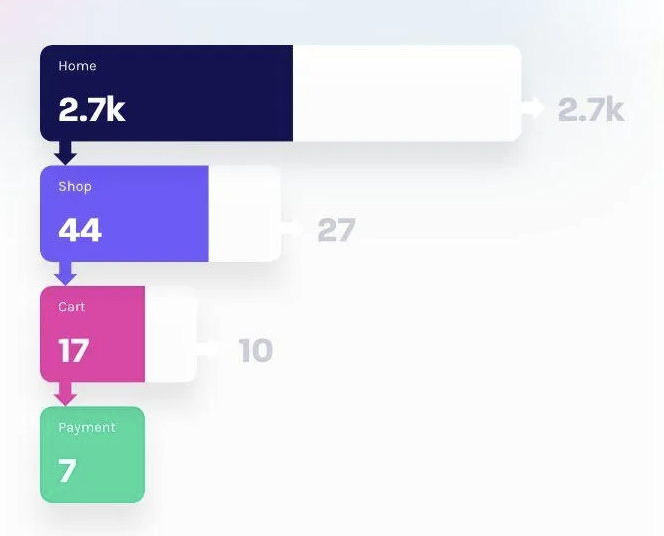
Visualize and analyze data. Advanced analytics tools will allow you to segment your data, or to sort it in a way that reveals key insights. In addition, some tools will allow you to visualize your data—for example, with graphs that show where users drop off in your funnel.
Create a feedback loop. After gaining key insights about what’s happening in your mobile app, you can then launch an improved version of it. By using mobile analytics to assess your changes and do more of what’s working, you can create a positive feedback loop in your development processes.
Understand your funnel’s performance with Glassbox
Glassbox lets you measure custom metrics from your funnel, so you can understand conversions, abandonment and revenue impact.
What mobile app analytics tools do you need to get started?
There are many mobile app analytics tools on the market today, so we've compiled a list to help you find the one that best fits your company's goals and needs.
1. Glassbox
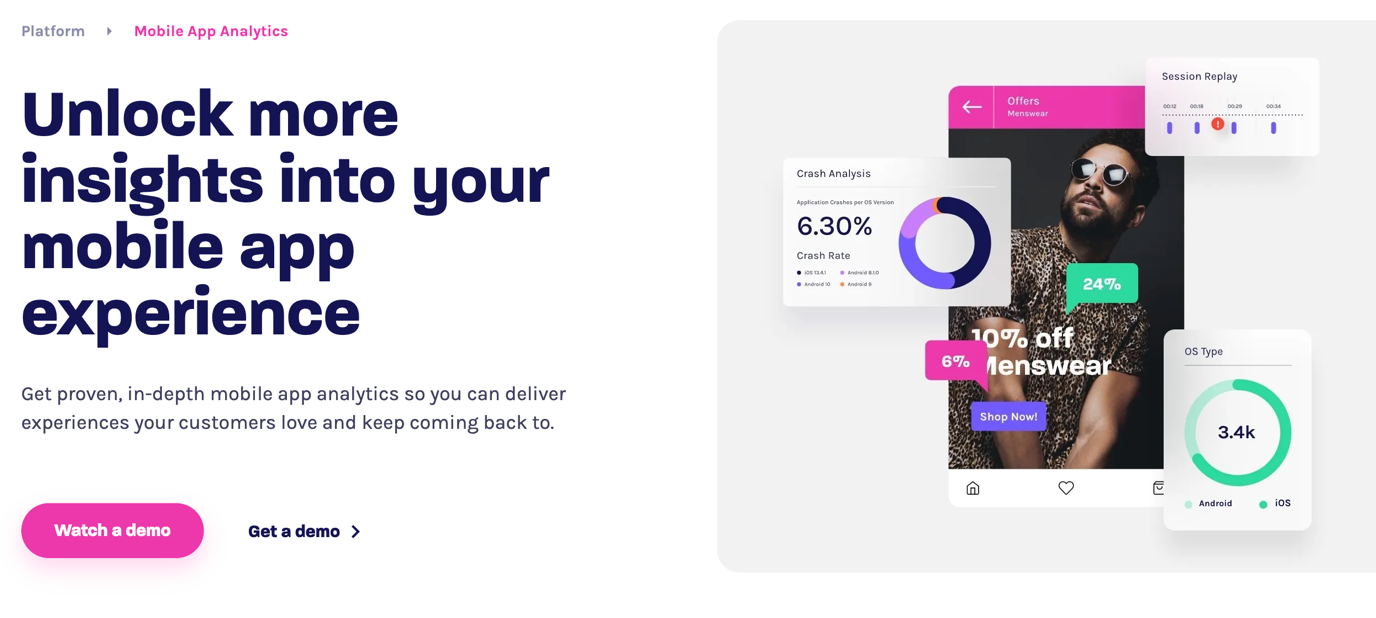
Glassbox is a digital experience intelligence platform that helps you understand and optimize user journeys.
It allows you to see the big picture of what’s happening inside your app, with detailed visualizations and performance reports. And to uncover the why behind key trends, Glassbox gives you a close-up look at the journeys of audience segments and individual users.
What’s more, Glassbox uses a lightweight SDK that gives you access to a suite of analytics tools without slowing your app down.
Features: Mobile app analytics, session replay, heatmaps and interactions maps, funnel analysis, customer journey mapping, struggle & error analysis, product analytics, advanced privacy and security features
2. Google Firebase
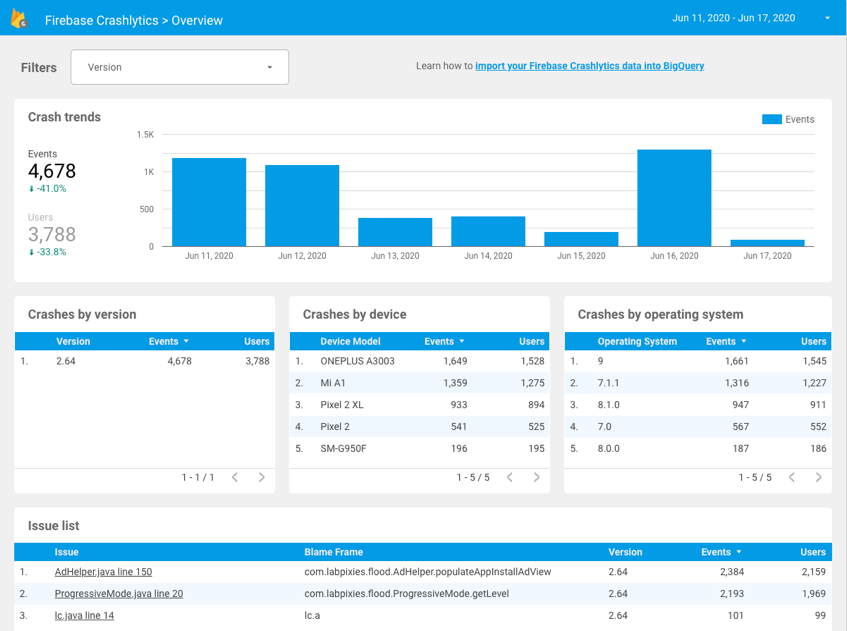
Source: Firebase
Firebase is an app developer platform backed by Google. It’s designed to help you build apps that meet Google’s standards—and on top of this, it offers free access to a range of helpful mobile app analytics tools.
Included in Firebase is Crashlytics, a tool which helps you resolve issues and find out why crashes occurred. The platform also enables Google Analytics for Firebase, which is a free app measurement solution.
Features: Crash reporting, event tracking, performance monitoring, app usage monitoring
3. Google AdMob

Source: Google
AdMob is Google’s advertising platform for mobile apps. Designed specifically for app developers, it allows you to monetize your app by displaying ads from Google Ads and other third-party ad buyers.
The platform also allows you to place your own ads so you can market your app elsewhere. Google AdMob is free to use and syncs with Google Firebase to give you a range of mobile app analytics tools.
Features: Automated ad bidding, multiple ad formats, analytics and reporting, easy integration through the AdMob SDK
4. Apple App Analytics

Source: App Store Connect
App Analytics is a mobile app analytics tool created by Apple. Part of a larger suite of tools called App Store Connect, it shows you how people are engaging with your app in the Apple store.
While it only works with iOS apps, the tool provides fundamental insights you can use to make marketing and product decisions. Learn how visitors discover your app, what channels bring visitors to your product page, what your app store conversion rate is and much more.
Features: Marketing campaign analysis, app store conversion insights, user engagement metrics, sales and trends reports


